|
|
|
|
1.1 The satellog database 1.1.1 Software Dependencies 1.1.2 Implementing the satellog database 1.1.3 Preliminary set-up 1.1.3.1 Detecting pure repeats with Tandem Repeats Finder (TRF) 1.1.3.2 Identifying unique repeat classes 1.1.3.3 Preparing expression data from the GeneNote database 1.1.3.4 Detecting repeat polymorphisms within UniGene clusters 1.1.4 Overview of the repeatalyzer.pl script 1.1.5 Generating a measure of repeat length significance 1.1.6 Detection and input of disease-associated repeats References Appendix A: Satellog MySQL Database Commands Appendix B: Running TRF on v.34 whole chromosome fasta files from UCSC Appendix C: Generating the repeat classifier Appendix D: Downloading and populating the GeneNote tables in Satellog Appendix E: Downloading and processing UniGene data Appendix F: Mapping the unique UniGene clusters to the human genome Appendix G: Generating the percentile rank for each repeat (p-values) Appendix H: Disease-associated repeats 1.1 The satellog database The build procedure for the Satellog database is outlined below and in the appendices. The body of this document provides a highlevel overview of the build procedure while the appendices provide detailed, step-by-step instructions for individuals interested in replicating the work. All work was done in a Linux environment and this document assumes user competence with Linux. Warning: generating the Satellog data from scratch requires a massively parallel computing platform in order to run the scripts in a timely manner. Most users are best served by running a local instance of Satellog for custom queries with the pre-processed MySQL tables available at Downloads .
A perl script repeatalyzer.pl functions as a wrapper for a number of different programs to achieve the endpoints of Satellog. repeatalyzer.pl is run with perl v5.6.1 and used BioPerl v1.2 (Stajich et al., 2002), the EnsEMBL Perl API (May 24th, 1999 release), MySQL v10.8 Distribution 3.23.21-beta (for pc-linux-gnu), BLAT v. 28 (Kent, 2002), the DBI and Descriptive perl modules and v. 34 of the human genome sequence (Lander et al., 2001). repeatalyzer.pl was run against the homo_sapiens_core_19_34b EnsEMBL database and v. 34 of the human genome sequence. The script was processed in parallel on our in-house 40 processor Opteron cluster.
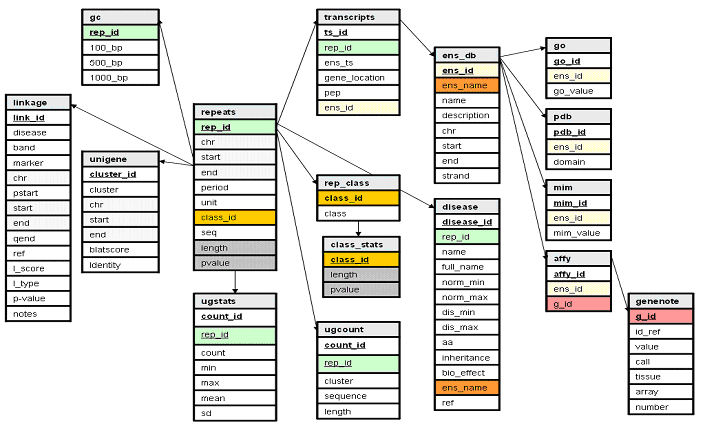
1.1.2 Implementing the satellog database Prior to proceeding, a MySQL database called Satellog must be implemented to generate all the required tables (Appendix A). The database is composed of 17 tables: repeats, linkage, unigene, gc, class_stats, ugstats, ugcount, rep_stats, rep_class, transcripts, ens_db, disease, go, pdb, mim, affy, and GeneNote (Figure 1). All tables are organized around the repeats table in a star schema. This table stores output from Tandem Repeats Finder (Benson, 1999) including chromosome start and end co-ordinates, repeat unit length (referred to as period), the sequence of the repeat unit, the distinct repeat class of which the repeat is a member of, the sequence of the repeat and pure repeat length. The p-value is calculated independently and represents the fraction of repeats of the same class having the same or greater length. The linkage table contains information about genomic linkage regions implicated in diseases of interest. For each disease linkage study, the linkage table stores the cytogenetic band of the genetic marker used, marker genomic co-ordinates, the original references PubMed ID, the linkage score if provided, the type of linkage, any reported p-values and notes of interesting or confounding principles. The pstart and qend values are co-ordinates encompassing 50 Mb flanking the genetic marker co-ordinates (recombination boundaries of the marker). The gc table contains the %GC of the 100 bp, 500 bp, and 1,000 bp of sequence flanking the repeat. The unigene table contains the genomic co-ordinates of each UniGene cluster successfully mapped to the human genome including its score from the BLAST-like Alignment Tool (BLAT) (Kent, 2002) and the percent identity of the alignment. The rep_class table stores a unique repeat class identifier that is created by concatenating all repeat class members in the class field. The class_stats table stores a pvalue for each repeat class length that represents the fraction of repeats of the same class having the same or greater length. The ugcount table links each unique repeat by its repeat ID (rep_id) to the UniGene cluster sequences it has been detected in by BLAT (Kent, 2002) and stores the repeats length in each hit cluster. The ugstats table collects summary statistics of all UniGene repeat length hits for each rep_id including the count (total number of hits), minimum value, maximum value, mean, and the standard deviation of all detected repeat lengths. Supplementary information about adjacent transcripts is collected in the transcripts table if a repeat is within 60 kb of an EnsEMBL defined gene. For each such repeat this includes the EnsEMBL transcript identifier, distance from or location within the EnsEMBL transcript, coding peptide sequence (if the repeat is exonic), and the EnsEMBL gene identifier of the hit. The ens_db table stores supplementary information of all the EnsEMBL genes that contain repeats. This table stores each EnsEMBL genes unique identifier, Human Genome Organization (HUGO) name, text description (if known), chromosomal co-ordinates and strand location. The go, pdb, mim, affy tables respectively store any Gene Ontology (Ashburner et al., 2000), Protein Data Bank (Berman et al., 2002), Mendelian Inheritance in Man (Wheeler et al., 2004), and AffyMetrix probe sets associated with each gene. The genenote table contains AffyMetrix expression values from the Gene Normal Tissue Expression (GeneNote) database, November 7, 2003 release (Shmueli et al., 2003). Specifically this table includes each probes identifier, expression value and expression call (either Absent (A), Marginal (M), or Present (P)) calculated from Microarray Analysis Suite (MAS) 5.0 with default parameters, AffyMetrix array and number.
Prior to running repeatalyzer.pl a number of preliminary programs need to be run plus staging databases are created to collect temporary data required for subsequent analyses.
1.1.3.1 Detecting pure repeats with Tandem Repeats
Finder (TRF) We were interested in exclusively pure repeat tracts which are more likely to expand following transmission (Chung et al., 1993; Kunst and Warren, 1994; Chong et al., 1995). Command-line TRF has seven parameters that can be manually assigned at run-time which include matching weight, mismatch and indel penalties, match probability, indel probability, minimum alignment score to report, and maximum period size to report (Benson, 1999). We found that matching weight, mismatch and indel penalties, minimum alignment score and maximum period size directly affected the length and purity of hits detected by TRF whereas changing the match and indel probability features was not useful. The match and indel probability features refer respectively to the percent identity and fraction of indels tolerated in each serial tandem unit detected as a hit. These features allow users to specify alternative expected matching and indel statistical distributions. Next we evaluated the ability of the matching weight
and maximum period size parameters to detect short repeats. Period size refers to the length of the
tandemly repeated Lastly we investigated the utility of adjusting the
mismatch and indel penalties. We found
that setting the penalty for these parameters to 4090 produced no impure
repeats as hits. TRF was run on whole
chromosome FASTA files from v. 34 of the human genome downloaded from the UCSC
genome browser. Hit purity was confirmed
by visually inspecting the top high period hits (these hits have the highest
probability of introducing indels due to the scoring scheme used by TRF (Benson, 1999) (Appendix B). 1.1.3.2 Identifying unique repeat classes A repeat can be represented in a
number of ways in double-stranded 1.1.3.3 Preparing expression data from the GeneNote
database The GeneNote (Gene Normal Tissue Expression) database
provides baseline normal expression data of human genes for use in disease
studies (Shmueli et al.,
2003). GeneNote data (November 7, 2003 release) was downloaded
from the Gene Expression Omnibus (GEO) (Appendix D). A total of twelve human tissue profiles are
presented in GeneNote including bone marrow, brain, heart, kidney, liver, lung,
pancreas, prostate, skeletal muscle, spinal cord, spleen, and thymus. These
products were generated with the AffyMetrix HG-U95 A-E probe-set, covering
62,839 probe-sets. EnsEMBL genes have
been mapped to AffyMetrix HG-U95 probes by the EnsEMBL project (Hubbard et al.,
2002). Once a repeat is detected
either inside or within 60 kb of an EnsEMBL gene, that genes normal expression
profile is evaluated by cross-referencing its AffyMetrix tags to the GeneNote
database within Satellog (Appendix D). 1.1.3.4 Detecting repeat polymorphisms within UniGene
clusters UniGene contains the largest public
repository of transcribed human sequence and represents an attempt to organize
this wealth of expression data into discrete transcriptional loci (Wheeler et al.,
2004). All human UniGene sequences
were processed for use with repeatalyzer.pl (Appendix
E). For each repeat detected in UTR or
exonic sequence, the repeat plus 10 bp of flanking sequence was extracted from
EnsEMBL and queried using the BLAT algorithm (Kent, 2002) against a BLAT-formatted database created from
sequences representing the longest, highest quality stretch of 1.1.4 Overview of the repeatalyzer.pl script Once the above software and data
dependencies are configured, the perl script repeatalyzer.pl automatically
populates Satellog. The script processes
the flat files output by TRF. These
files contain the repeat co-ordinates plus the repeat period (the size of the
repeated unit), the sequence of the individual repeat unit, the entire
repetitive sequence and the repeat length.
Repeat co-ordinates are passed to the EnsEMBL 1.1.5 Generating a measure of repeat length significance After running the script to populate
Satellog, each repeats length is compared to its class genomic repeat length
profile. The majority of repeats
associated with disease undergo expansions from already large reference genome
lengths relative to other repeats of the same class (Cleary and Pearson, 2003). The
percentile rank of each repeat length (referred to as p-value in Satellog) is
calculated from the distribution of repeat lengths within each repeats class (Appendix
G). It reflects the proportion of
repeats with the same or greater length from the repeats genomic length distribution. 1.1.6 Detection and input of disease-associated repeats Disease-associated repeats and their common properties were recently reviewed (Cleary and Pearson, 2003). Repeats that were not analyzed either had a repeat period greater than 16 (thus not detected by our TRF parameters) or were polymorphic but not associated with any disease. For these disease-associated repeats, there is no record of their precise genomic co-ordinates. To address this, we used Satellog to manually probe for the probable repeat that corresponded to each disease by selecting all repeats of the expected class within each disease gene. Except for the repeat responsible for blepharophimosis (Crisponi et al., 2001), all repeats were detected. A total of 51 repeats were mapped for 31 diseases (Appendix H). Since this data was generated manually, users are encouraged to download the MySQL table (disease) directly from Downloads.
^ top
|
|
|
||||||||||||||||||||
|
||||